Bitcoin is showing very interesting priceaction right now, which is a change of direction from down to the upward. So I wanted to share my percpective and created a short video.
The BTC/USD pair was trying to penetrate 400 level several times and finally did. Then we found that the breakout was a false.
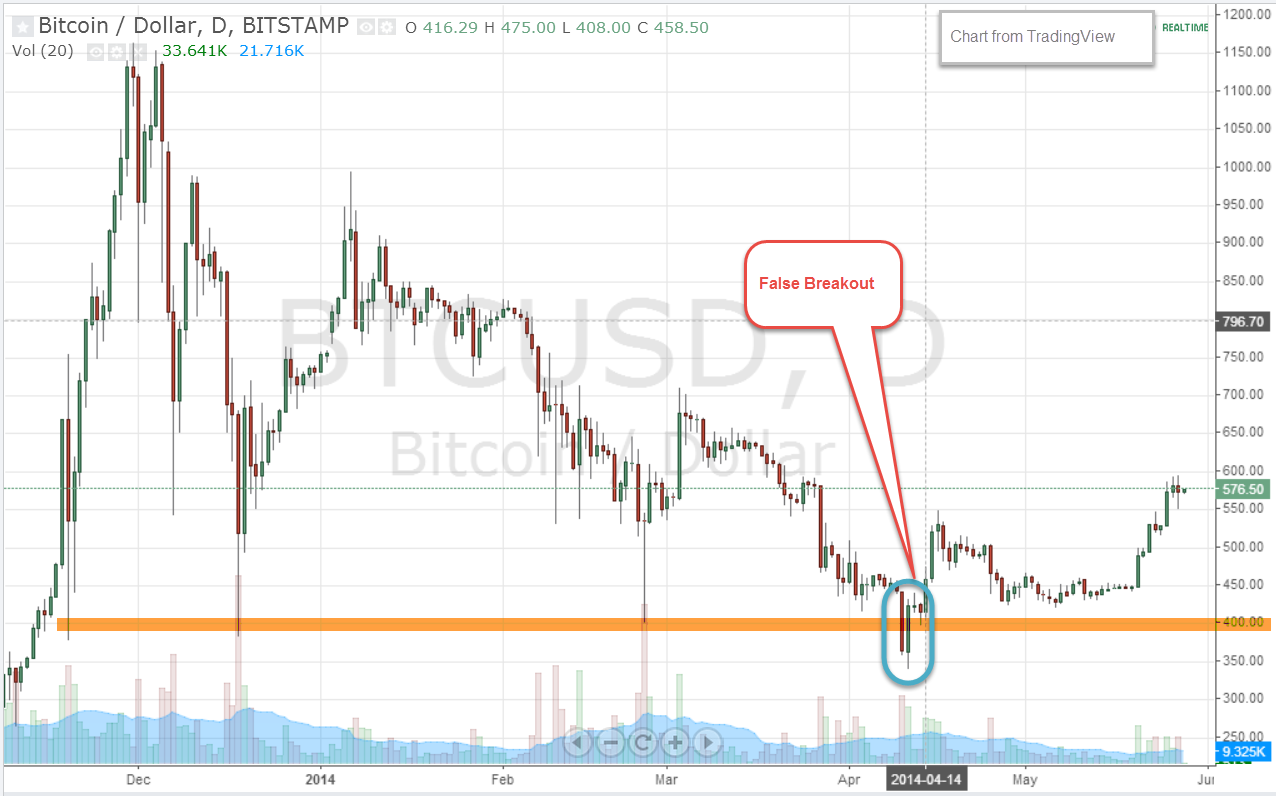
Now the pair is printing new higher high and this indicates the change of direction.
Within the video, it demonstrate how the priceaction may work and trying to emulate how market is looking at the chart which drives the price at all.
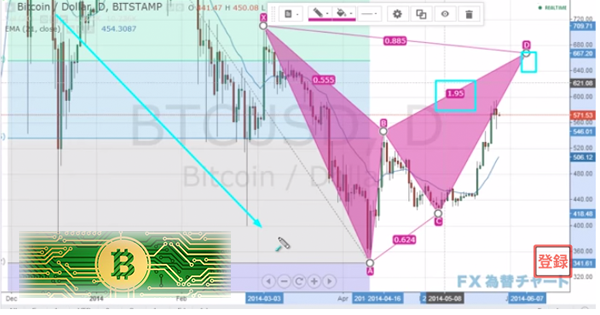
Tools used within the video includes;
- Fibonacci Retracement
- Harmonic BAT Pattern
- EMA
- Candle Pattern
- Support & Resistance zone
By the way, this is my first trial demonstrating in other language other than Japanese. So any comments are highly appreciated to motivate me creating another version of this video!
Thank you.
この投稿について
いつもココスタを見て頂いてありがとうございます。
いままで欧米のノウハウを日本へ紹介する一方通行だったのですが、試しに英語でプライスアクションのデモを欧米市場に向けて流してみた場合の反応を見てみたくなり、動画を作成してみました。
下手な英語で何の反応も海外からなければ取り下げる予定ですので、管理人のちょっとした挑戦と、大目に見てやって頂けると嬉しいです。